How do I read my dashboard?
The dashboard has two halves. "Recent performance" is about your last few meetings; "Performance over time" is about your trend. Work down it in this order.
Set the filters first. "Meeting Type" at the top filters Recent performance; the "Time" selector controls Performance over time and offers This month, Last month, 3 months, 6 months or 12 months.
Read "Your trends" — two cards. "Most improved" names the factor climbing fastest; "Focus area" names the one falling. Each shows a score out of 100, the change against your previous five meetings, and five small bars for those meetings so you can see whether the change is a genuine trend or one bad meeting.
Read "Progress over your last 5 meetings" — three numbered coaching points, each tagged with the specific sub-factor behind it, such as Preparation, Concise or Passion. These are the most directly actionable items on the page.
Scan "All Completed Meetings" — every analyzed meeting with its date, Internal or External tag, and its Relate Trust Index level. Search by title or click the arrow on any row to open the full report.
How to read the dashboard graphs
Four charts sit under "Performance over time", plus the Scoreboard down the right-hand side.
Average Relate Trust Index — a single line showing your overall trust level month by month. Note that the vertical axis is not numbered: it is banded into Developing, Skilled and Expert, with dotted lines marking the boundaries. Read the shape rather than exact values — a line climbing through a boundary means you have moved up a level.
Average trust scorecard — your averages for the period. Credibility, Reliability and Intimacy each appear as a semicircular gauge: the green arc is your score out of 100, with the level named underneath. Self-orientation sits below as a horizontal bar instead of a gauge, because lower is better for it and a gauge would imply the opposite.
Benchmark trust index — the same trust-level line chart, but with two lines: pink for Personal and blue for Organization. Where the pink line sits above the blue, you are ahead of your organization's average for that month. Hover any point to see the month and the level for both. This chart is the single best answer to "how am I doing relative to everyone else?"
Benchmark trust scorecard — a grouped bar chart comparing you against the organization factor by factor, pink for Personal and blue for Organization, with each value labeled on the bar. It has two toggles: "Others" shows Credibility, Reliability and Intimacy together, and "Self..." shows Self-orientation on its own, again because its direction is reversed. This chart carries both scales — level bands on the left, numbers 0 to 100 on the right.
Scoreboard — your best and worst single-meeting scores for the period, toggled by Highest and Lowest, plus counts of total, internal and external meetings with small sparklines showing distribution over time. One trap worth knowing: because lower is better for Self-orientation, its figure under "Lowest" is your best-ever Self-orientation result, not your worst.
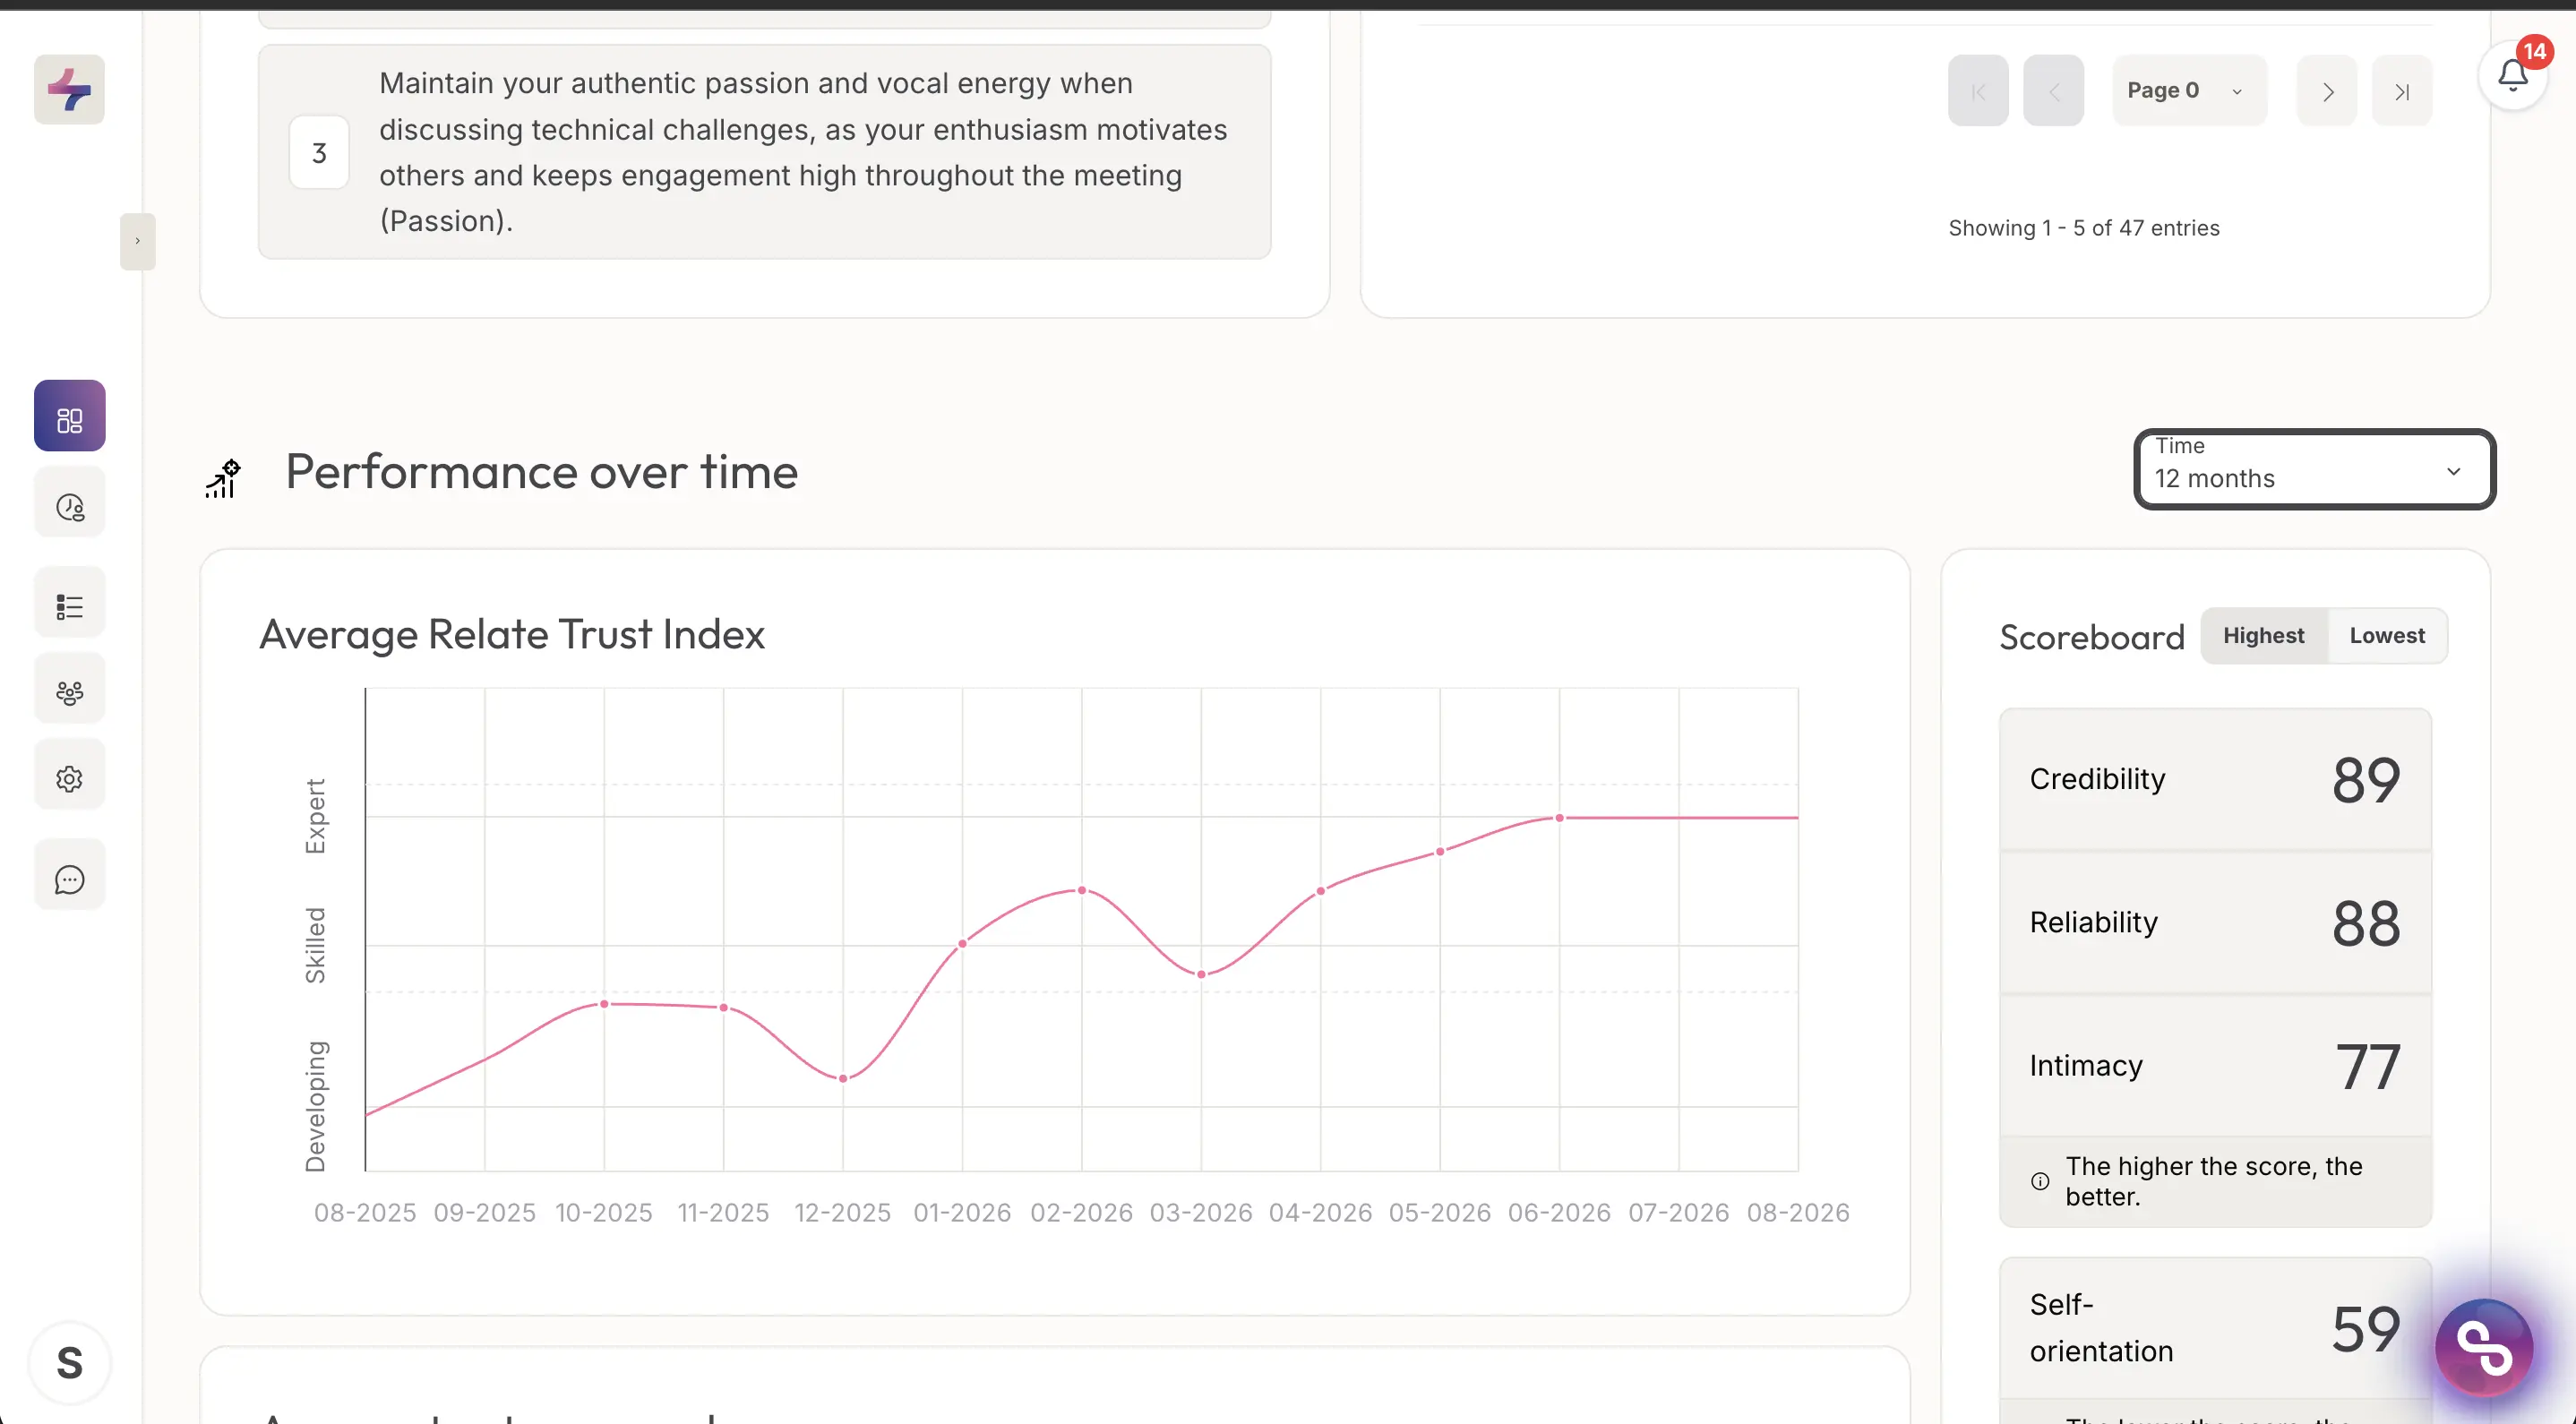
Performance over time, with the Time filter set to 12 months. Note the banded vertical axis on the trend chart.